
Your Paris trip booking confirmation just hit your inbox—champagne time! Until you remember last year’s Florence fiasco when sudden thunderstorms flooded your Airbnb and canceled your Colosseum tour. Generic 30% rain alerts won’t save you; you need a real-time travel weather map showing exactly where storms will hit while you’re touring the Vatican. Over 68% of travelers abandon activities due to unanticipated weather (per NOAA data), but those using dynamic weather maps adjust plans before disasters strike. In this guide, you’ll learn to decode radar layers, predict micro-weather shifts, and transform your travel weather map into a trip-saving GPS for sunshine.
Stop guessing when to pack rain gear. We’ll reveal how to spot developing squall lines 48 hours out, interpret airport-specific wind maps, and leverage free tools that even seasoned pilots use. By the end, you’ll know precisely whether to reschedule that Santorini boat tour or grab last-minute tickets to Barcelona’s Sagrada Família when clouds roll in.
Why Generic Weather Apps Fail Travelers
Your standard weather app shows “Partly Cloudy” for Rome—but that’s useless when you need to know if rain will drench your Colosseum ticketed entry at 2 PM. Generic forecasts lack three critical travel elements: hyperlocal timing, terrain impacts, and transportation disruption alerts. Mountain valleys like Switzerland’s Lauterbrunnen get 2x more rain than valley-floor forecasts predict due to orographic lift. Coastal airports like Lisbon’s Humberto Delgado face sudden fog banks invisible in city-wide reports.
How Terrain Distorts Your Forecast
- Valleys trap cold air: In Denver, downtown might be 65°F while Red Rocks Amphitheatre (1,000ft higher) freezes at 48°F
- Coastal microclimates: Lisbon’s downtown stays dry while Cascais (20 miles west) gets drenched in Atlantic squalls
- Urban heat islands: Paris city center runs 7°F hotter than Charles de Gaulle Airport—critical for flight delays
When Airport Weather Maps Save Your Trip
Spot these red flags before heading to the terminal:
– Ceiling height below 1,000 feet (check METAR maps) = High flight cancellation risk
– Wind shear alerts near mountain airports (e.g., Aspen) = Turbulence danger
– Freezing rain icons within 50 miles of hub airports = Domino-effect delays
Decoding Travel Weather Map Symbols Like a Pro
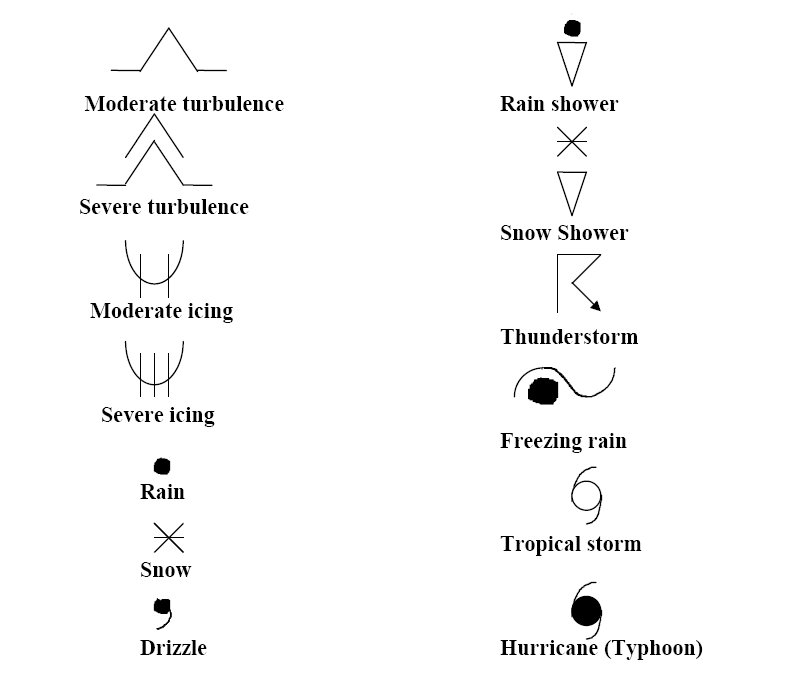
Forget confusing radar blobs. Focus on these 4 layers that actually impact your itinerary:
Precipitation Intensity vs. Timing Maps
| Symbol Color | What It Means | Travel Impact |
|---|---|---|
| Light blue | Drizzle (0.01-0.1″/hr) | Pack umbrella; outdoor tours proceed |
| Dark red | Heavy rain (0.5″+/hr) | Cancel boat tours; seek indoor alternatives |
| Purple | Thunderstorms | Immediate shelter required; avoid hiking |
| Pro Tip: Toggle the “1-hour accumulation” layer to see if rain stops before your 3 PM Vatican tour. |
Jet Stream Position for Long-Haul Flights
That turbulent transatlantic flight? Blame the polar jet stream. On your travel weather map:
1. Find the purple dashed line (12,000+ ft wind currents)
2. If it crosses your flight path perpendicularly, expect severe bumps
3. Southwest-flowing streams (→) mean smooth sailing; northwest dips (↗) signal turbulence
How to Read 72-Hour Forecast Maps for Trip Adjustments
Most travelers check weather the night before—but critical shifts happen 3 days out. Here’s your timeline:
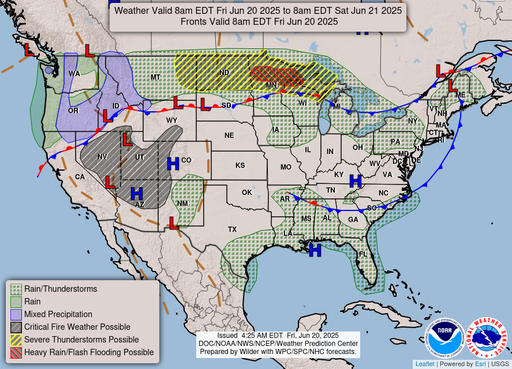
Day 3: The Window for Major Changes
- Spot high-pressure domes (large “H” icons): Lock in outdoor activities here
- Watch cold front collisions (blue line meeting red line): = Guaranteed rain 12-24 hours post-collision
- Action: If fronts hit during your hike, swap to museum days using this free tool: NOAA’s 500mb Height Forecast
Day 1: The Precision Adjustment Phase
- Zoom to hourly precipitation maps: Will rain clear by 11 AM for your Alhambra tour?
- Check “feels like” temperature layers: Humidity makes 75°F feel like 85°F in Bangkok
- Critical move: Enable “road weather” overlays for mountain passes (e.g., Alps tunnels close for ice at 28°F)
Mobile Travel Weather Map Hacks for On-the-Go Trips
Desktop maps are useless when you’re stranded in a Lisbon downpour. Master these mobile tricks:
The 3-Tap Emergency Protocol
- Tap once: Enable “lightning strike” layer (red dots = danger within 10 miles)
- Tap twice: Activate “rain start/end” timer for your exact GPS pin
- Tap thrice: Pull up nearest indoor shelters (museums, malls, train stations)
Offline Map Lifesavers
Download these before losing service:
– Windy.com’s “Offline Areas”: Save European mountain regions showing snow levels
– NOAA Radar Live: Pre-load Caribbean hurricane tracks with 6-hour buffers
– Critical: Always cache airport-specific maps—JFK’s wind direction map predicts taxi delays
When to Trust (and Doubt) Your Travel Weather Map
Not all maps are equal. Avoid these costly mistakes:
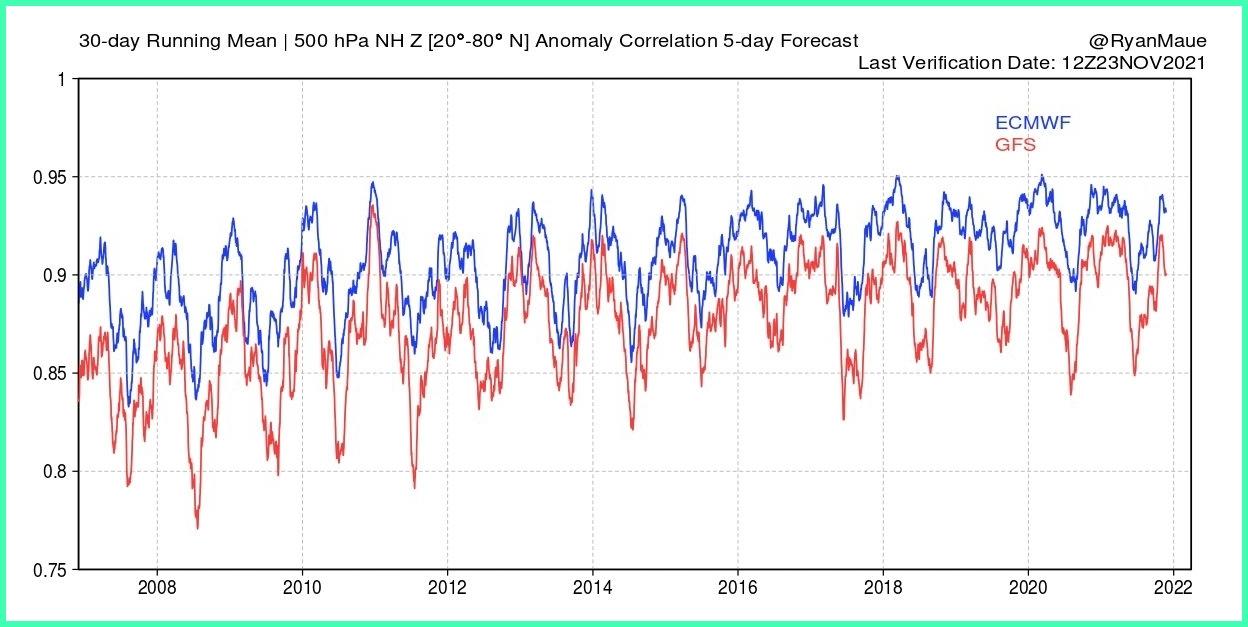
The Single-Model Trap
Relying solely on one source (like AccuWeather) risks disaster. Always cross-check:
– European Model (ECMWF): Best for 5+ day forecasts (critical for booking flexibility)
– American Model (GFS): Superior for sudden thunderstorms in mountain zones
– Red flag: If models disagree by >15°F on temperature, expect volatile conditions
Social Media Weather Scams
“Live storm cams” on Instagram often show outdated footage. Verify with:
– Official airport webcams (e.g., “Zurich Airport Webcam” not “Swiss Alps Cam”)
– NOAA Weather Radio app for real-time tsunami/tsunami alerts
– Never trust influencer “rain forecasts”—they use generic city data
Emergency Weather Map Reading for Crisis Situations
When Typhoon Hagibis flooded Tokyo subways in 2019, travelers with radar apps escaped. Learn these life-saving techniques:
Flood Zone Identification
On your travel weather map:
1. Find “soil moisture” layer (dark green = saturated ground)
2. Check “streamflow forecasts” for rivers near your hotel
3. If both show red, move to higher floors immediately
Wildfire Smoke Navigation
During Canadian wildfires, Paris air quality hit hazardous levels. Protect yourself by:
– Tracking “aerosol optical depth” maps (purple = dangerous particulates)
– Using “wind direction arrows” to avoid smoke corridors
– Pro Tip: PurpleAir.com shows real-time street-level air quality
Building Your Personalized Travel Weather Map Dashboard
Stop juggling 5 apps. Create one master view:
The 3-Panel Must-Have Setup
| Panel | Tool | Why It Matters |
|---|---|---|
| Left | Tropical Tidbits | Tracks Atlantic hurricanes 10 days out |
| Center | Windy.com | Animated jet stream + rain layers |
| Right | FlightRadar24 | Live airport weather causing delays |
Setup in 2 minutes: Bookmark this free NOAA Traveler Dashboard showing global hazards.
Last-Minute Travel Weather Map Checklist
Run this 24-hour pre-departure scan:
- Airport-specific maps: Check for crosswinds >25 knots (cancels small planes)
- Coastal surge alerts: Red “wave height” icons near beach destinations = rip current danger
- Volcanic ash layers: Critical for Iceland/Indonesia trips (ground stops flights)
Never skip this: The “cloud ceiling” map determines if your Santorini caldera hike gets canceled
Maintain Your Weather Map Skills Between Trips
Great travelers don’t just check maps—they build prediction instincts:
- Weekly drill: Compare your 7-day forecast vs. actual weather for your city
- Track one storm: Follow a hurricane’s ECMWF vs. GFS model shifts for 3 days
- Join NOAA webinars: Free monthly sessions on interpreting aviation weather maps
Your next adventure doesn’t need to drown in surprises. A real travel weather map transforms vague “chance of rain” into precise “pack raincoat from 2:15-3:45 PM at Eiffel Tower.” Bookmark NOAA’s Traveler Weather Hub, master the 3-tap emergency protocol, and watch your trip confidence soar. When sudden storms cancel others’ plans, you’ll be the one swapping to a perfect indoor flamenco show in Seville—because you saw the clouds coming 48 hours early.
Final Tip: Always carry a physical weather radio (like Midland ER310) for zero-service emergencies. When your phone dies during monsoons, it’s the difference between panic and peace.